
| Platform | Licensing model | Best for | Learning curve | Clinical-trial credibility |
|---|---|---|---|---|
| SPSS | Paid, subscription, IBM | General clinical outcome-measure analysis, repeated-measures designs, mixed undergraduate/masters cohorts | Low — menu-driven | Widely accepted; the default most examiners recognise |
| jamovi | Free, open source | Undergraduate and taught-masters projects without a dedicated SPSS licence, reproducible-analysis teaching | Low — SPSS-like menu interface | Growing acceptance; less universally recognised by older examiners than SPSS |
| GraphPad Prism | Paid, subscription | Small-sample clinical and pre-clinical outcome data, publication-quality dose-response and survival curves | Low to moderate — guided workflows built around common clinical designs | High in clinical and biomedical journals specifically; the field-standard for trial-style figures |
| R | Free, open source | Advanced or non-standard outcome-measure modelling, meta-analysis, reproducible scripts across a research group | Steep — full programming language | High among methodologically advanced examiners; less familiar to a purely clinical panel |
| REDCap | Free for academic/non-profit institutional use, self-hosted or institution-hosted | Structured clinical data capture — not analysis itself, but the intake layer feeding into any of the above | Low for data entry, moderate for form design | The de facto standard for clinical research data capture at most health faculties |
These five are not five competing choices for the same job — REDCap is a data-capture layer, not an analysis package, and the other four are analysis tools that typically sit downstream of it. The comparison that matters for an allied-health faculty is less “which one wins” and more “which combination matches our students’ typical outcome-measure designs and our examiners’ expectations.”
Why allied-health outcome-measure analysis is a distinct category

Physiotherapy, occupational therapy, podiatry and comparable allied-health theses typically analyse standardised outcome measures — validated scales like the Berg Balance Scale, the Oswestry Disability Index, or a goniometry-based range-of-motion measure — collected pre- and post-intervention on genuinely small clinical samples, often single-digit to low double-digit participant counts for a taught-masters project. This combination — small n, repeated measures, clinically validated instruments with established minimal-clinically-important-difference thresholds — is a different statistical profile from a large-sample survey or a big-data analysis, and it favours tools built around exactly this kind of design over general-purpose statistical software chosen for its comprehensiveness. The same small-cohort clustering that shapes supervision demand in taught masters dissertation season applies here too — allied-health placements and data-collection windows are seasonal, and analysis-software teaching should be timed to when students are actually about to use it.
SPSS and jamovi: the accessible default and its free equivalent
SPSS remains the software most allied-health examiners are personally familiar with, which has real value at the point of viva or thesis defence — an examiner who already knows the software’s standard output format spends their attention on the results, not on decoding an unfamiliar table layout. jamovi, built by a team that explicitly designed it to mirror SPSS’s menu structure while remaining free and open source, is a legitimate lower-cost substitute for a faculty without a full SPSS site licence, and it produces broadly equivalent output for the repeated-measures ANOVA, paired t-tests and non-parametric tests that dominate allied-health outcome analysis. The trade-off is recognition: an examiner encountering jamovi output for the first time needs a moment longer to orient than one reading familiar SPSS tables, which is a minor but real friction a supervisor should flag to students before submission.
GraphPad Prism: the field-specific choice for clinical-style figures
GraphPad Prism is not a general statistics package competing with SPSS on breadth — it is a narrower, clinically-focused tool built around exactly the designs allied-health research produces: before-and-after comparisons, dose-response curves, survival analysis, and publication-ready figure formatting that matches the visual conventions of clinical and biomedical journals. For a thesis aiming to produce figures a supervisor might later use in a journal submission, or for a project already following a clinical-trial-style design, Prism’s guided workflows for these specific analyses reduce the risk of a student selecting an inappropriate test, since the software’s structure nudges toward field-standard choices. Its narrower scope is also a limitation — a thesis needing complex multivariate modelling or structural equation modelling will outgrow Prism and need R or a comparable general package instead.
R: the right choice only when the project genuinely needs it
R’s advantage for allied-health research is reproducibility and access to specialised packages — meta-analysis packages for a systematic-review-with-meta-analysis thesis, mixed-effects modelling for a more complex repeated-measures design than a simple pre/post comparison, or non-standard outcome-measure psychometric analysis. For the majority of taught-masters allied-health projects, this capability goes unused, and the training-time cost of teaching R to a cohort whose actual statistical needs are met by SPSS, jamovi or Prism is not justified. R earns its place for doctoral-level or genuinely methodologically advanced allied-health research, not as a default for the whole faculty.
REDCap: the data-capture decision that precedes the analysis decision
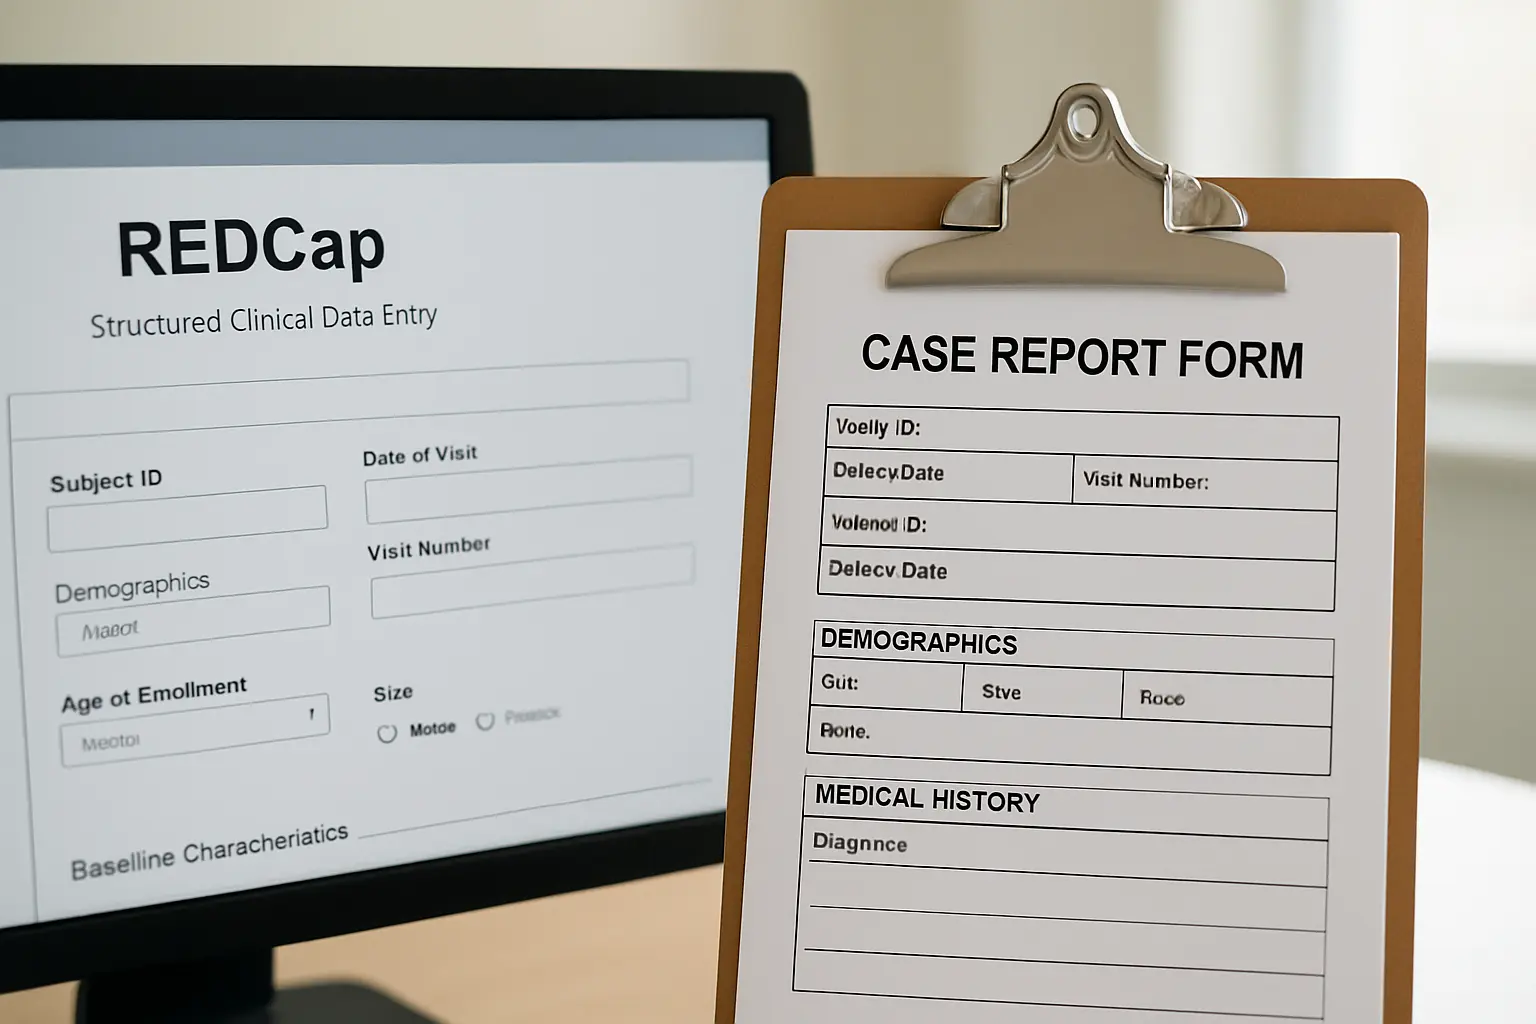
Before any of the analysis packages above matter, most allied-health clinical data collection runs through a structured capture tool, and REDCap is the field’s de facto standard — free for academic and non-profit institutional use, built specifically around clinical research forms, audit trails and role-based access that satisfy institutional data-governance requirements for patient-adjacent data. A faculty standardising its analysis software without first confirming REDCap (or an equivalent structured capture tool) is in place for the data-collection stage is solving only half the workflow — clean, well-structured REDCap exports feed directly into SPSS, jamovi, Prism or R with minimal reformatting, while ad hoc spreadsheet-based data collection routinely produces the messy, inconsistently coded data that consumes a disproportionate share of a student’s and supervisor’s time before any actual analysis can begin.
Training rollout and licence-cost planning across a mixed toolkit

A faculty running a tiered model — jamovi or SPSS for most projects, Prism for a clinical-trial-track subset, R reserved for doctoral and advanced work — should apply the same phased-cohort discipline that works for any faculty-wide tooling change: introduce a new default for incoming cohorts only, keep prior-tool support available but not actively taught for one or two further intakes, and tie the software-specific teaching session to the point in the programme where students select their research design rather than an early induction-week session too far removed from actual use to be retained. Licence seats for SPSS and Prism should be planned against the sub-cohort that actually needs them — the clinical-trial-track subset for Prism, the wider cohort for SPSS or jamovi — rather than purchased for the full faculty by default, since jamovi’s free licensing already covers the majority of standard outcome-measure comparisons without any per-seat cost at all.
Where this decision sits relative to broader faculty software standardisation
This is the allied-health-specific version of a decision every quantitatively-oriented faculty eventually faces — see how an Accounting and Finance faculty standardises its statistical software for the same tiering logic applied to a very different data-platform ecosystem (WRDS and market data rather than REDCap and clinical instruments). In both fields the underlying principle is identical: match the tool to the actual research design and data-capture workflow a cohort runs, rather than picking one default for the whole faculty regardless of project type. It also connects to the reference-management side of the same standardisation question — see the faculty reference-manager comparison for how a parallel tooling decision was resolved for citation software.
A template decision framework
| Project type | Recommended default | Why |
|---|---|---|
| Standard pre/post outcome-measure comparison, small sample | SPSS or jamovi | Matches the standard repeated-measures design; examiner-familiar output |
| Clinical-trial-style design aiming for publication-quality figures | GraphPad Prism | Guided workflows for dose-response, survival and before/after clinical designs |
| Systematic review with meta-analysis, or complex mixed-effects modelling | R | Specialised packages unmatched by menu-driven tools |
| Any project collecting original clinical data | REDCap for capture, feeding into the analysis tool above | Structured, auditable data capture that satisfies institutional governance requirements |
Recommendation
jamovi is the strongest default for a faculty without an existing full SPSS site licence, given its free cost and SPSS-equivalent menu structure for the repeated-measures and standard clinical-comparison tests that dominate allied-health outcome analysis. The named alternative is SPSS itself, specifically where an institutional licence already exists and examiner familiarity with its exact output format is valued highly enough to justify the licensing cost. GraphPad Prism is worth standardising on separately for any track explicitly aiming at clinical-trial-style or publication-oriented projects, and REDCap should be the default data-capture layer regardless of which analysis package a project ultimately uses.
Where Tesify fits
Whichever combination a student uses, the methods chapter still needs to cite the outcome-measure instrument, the software and version, and REDCap or another capture tool correctly and consistently. The Tesify Citation Engine for Institutions keeps instrument and software citations consistent with the faculty’s required style as students draft their methodology chapters. A free departmental pilot lets an allied-health programme test this against one dissertation cycle before any procurement decision.
Frequently asked questions
Is jamovi an acceptable substitute for SPSS in an allied-health thesis?
Yes, functionally — it produces broadly equivalent output for the standard tests allied-health outcome analysis uses. The only real trade-off is examiner familiarity, since some examiners will take slightly longer to orient to jamovi’s output format than SPSS’s.
Why is GraphPad Prism preferred over general statistics software in clinical allied-health research?
Its guided workflows are built specifically around the before/after, dose-response and survival-analysis designs common in clinical research, which reduces the risk of a student selecting an inappropriate test and produces figures that match clinical-journal visual conventions.
Does every allied-health thesis need REDCap for data collection?
Any project collecting original clinical or patient-adjacent data benefits from it — the structured forms, audit trail and role-based access satisfy institutional data-governance requirements that an ad hoc spreadsheet does not, and clean REDCap exports save substantial reformatting time before analysis.
When does a project actually need R instead of a menu-driven package?
For systematic reviews with meta-analysis, mixed-effects modelling beyond a simple repeated-measures design, or non-standard psychometric analysis of an outcome instrument — capabilities the menu-driven tools do not cover, not as a default for standard pre/post comparisons.
Should a faculty standardise on one tool for every allied-health sub-discipline?
No. Physiotherapy, occupational therapy and podiatry projects share a common statistical profile — small-sample, repeated-measures, validated outcome instruments — but the right tool still depends on whether the project is a standard comparison, a clinical-trial-style design, or a review-and-synthesis project.
Is a paid GraphPad Prism licence worth it for a faculty already using SPSS?
Only for tracks explicitly producing clinical-trial-style or publication-oriented figures. For a general allied-health cohort running standard outcome comparisons, SPSS or jamovi already covers the actual statistical need without a second licence.
Should REDCap seats be purchased for every student or only those collecting original data?
Only students collecting original clinical or patient-adjacent data need REDCap access — a project using secondary data analysis or a fully anonymised existing dataset has no need for a structured capture tool and should not be counted in REDCap seat planning.
How should a faculty roll out a change from SPSS to jamovi without disrupting current students?
Apply the new default to incoming cohorts only, keep SPSS support available but no longer actively taught for one or two further intakes, and tie the jamovi teaching session to the point where students select their research design rather than an early induction session.