
The headline finding: a free, unauthenticated API returns a country-level count of doctoral theses in a single HTTP call, and it currently indexes 3,142,531 of them. Measured against the one official national denominator we could read, it captures roughly half of the theses actually produced. Both numbers are useful; quoting the first without the second is not.
This article gives you the figures, the exact query that reproduces them, and the three coverage limits to state whenever you cite them.
The instrument
The OpenAIRE Graph aggregates metadata from institutional and national repositories across Europe and beyond, and exposes a search endpoint at api.openaire.eu/search/publications. It requires no key and no registration for counting queries, and setting size=0 returns the total without the records — which is exactly what an institutional researcher needs.
The parameters that matter here are instancetype=Doctoral thesis, country as a two-letter code, and fromDateAccepted / toDateAccepted for a year window. Every figure below was retrieved on 18 August 2026 and can be re-run.

The figures
| Country | All doctoral theses indexed | Dated 2024 |
|---|---|---|
| Germany | 271,822 | 14,804 |
| United States | 214,544 | 10,225 |
| Spain | 190,472 | 11,137 |
| Netherlands | 131,213 | 11,779 |
| United Kingdom | 115,323 | 5,516 |
| All countries | 3,142,531 | 154,889 |
Two things in that table should stop you before you quote any of it in a business case.
The Netherlands, a country of roughly 18 million people, appears to have produced almost as many doctoral theses in 2024 as Germany, a country of roughly 84 million. And the United Kingdom, which awards doctorates on a scale comparable to Germany’s, appears at barely a third of the German figure. Those are not findings about doctoral education. They are findings about repository infrastructure and metadata practice.
The coverage ratio, measured
To turn the index into something citable, you need an official denominator, and one is publicly readable.
The German Federal Statistical Office publishes doctoral examinations passed, with results revised as at 5 February 2026:
| Examination year | Doctorates awarded, Germany |
|---|---|
| 2022 | 27,692 |
| 2023 | 26,570 |
| 2024 | 28,171 |
Of the 2024 total, 13,024 were awarded to women. The figures are also published by Land: North Rhine-Westphalia 5,796, Bavaria 4,744 and Baden-Württemberg 4,446 lead, and Bremen at 320 and Brandenburg at 413 sit at the other end.
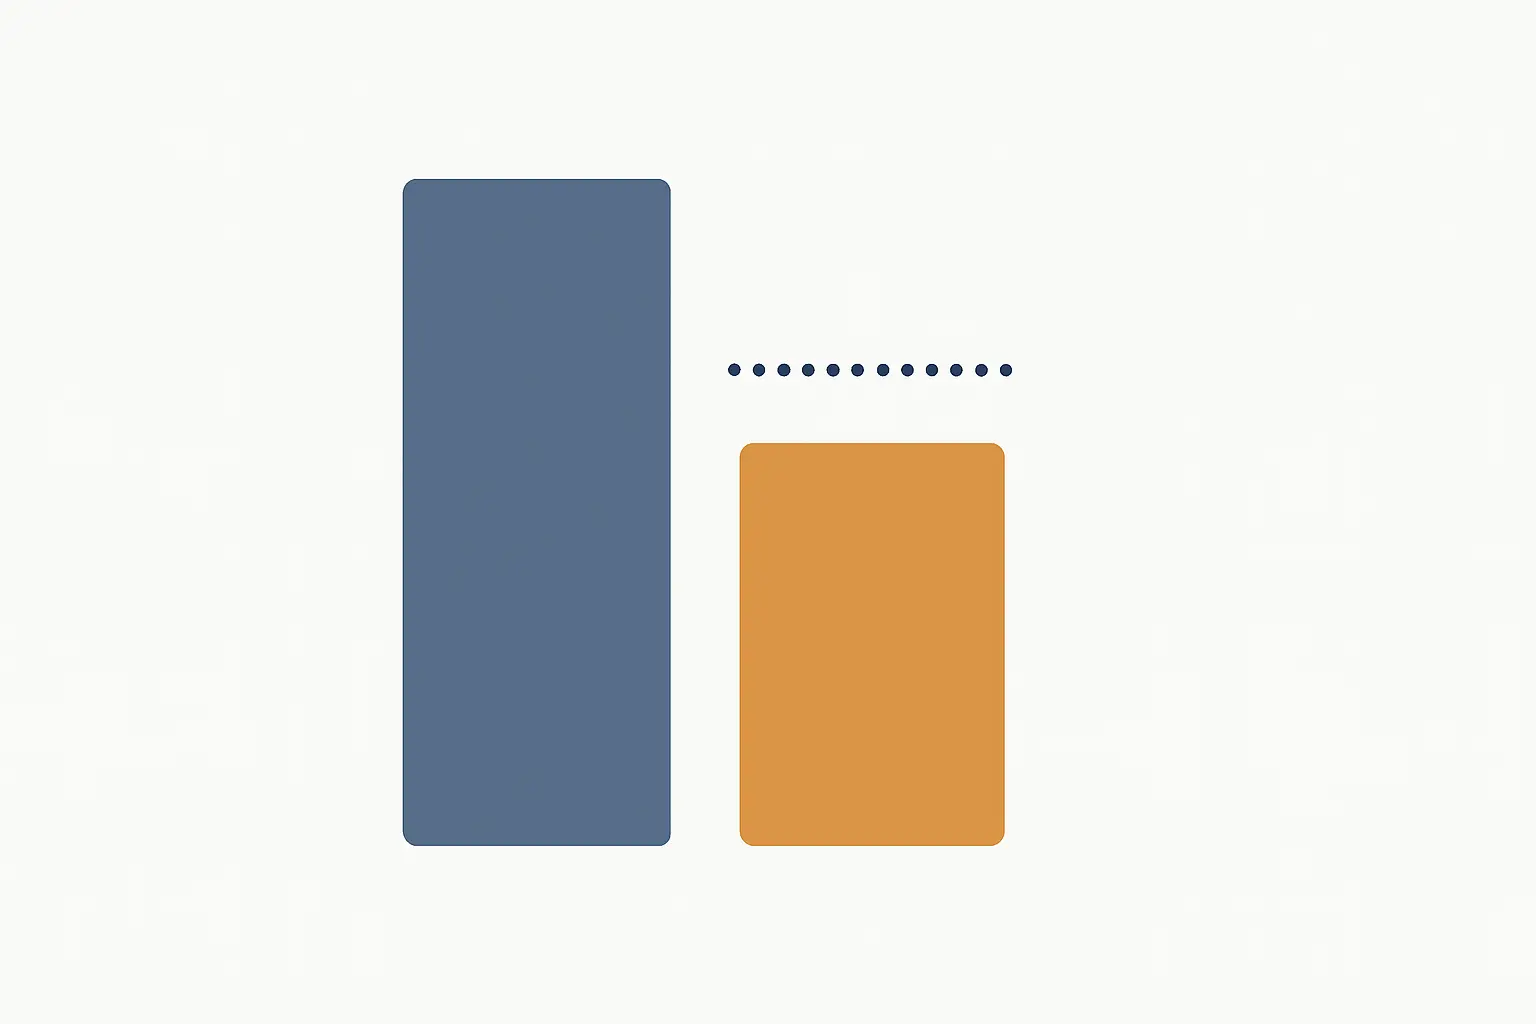
So the arithmetic is: 14,804 indexed against 28,171 awarded, a coverage ratio of about 53%.
That is the sentence to carry. It is a single country and a single year, and it should be presented as one measured data point rather than a general capture rate — but it is a measured one, which is more than most citations of aggregate repository totals can claim.
The three limits to state whenever you cite this
1. Aggregation lag inflates the most recent complete year and deflates the one before it. The world total for 2025 came back as 220,825 against 154,889 for 2024. A 43% year-on-year rise in doctoral output did not happen. What changed is how much of each year has reached the index, and in which direction records are still arriving. Never present two adjacent years from an aggregator as a trend.
2. National infrastructure decides national coverage. Where a country has a well-populated national or institutional repository network, its theses appear. Where doctoral output flows mainly to a commercial supplier or to a service that is not currently harvestable, it does not. The consequence is that a cross-country table from this source measures deposit practice at least as much as it measures scholarship, and the ranking should never be presented as a ranking of research output.
We tried to establish the position for the United Kingdom directly and could not: two British Library URLs for its doctoral thesis service returned HTTP 404 on 18 August 2026, and the DART-Europe portal returned HTTP 403. Rather than guess at a cause, establish it locally before you explain a national figure to a committee.
3. Type labelling is not consistent between repositories. A record is counted here because some repository typed it as a doctoral thesis. Where local practice types master’s dissertations or licentiate work the same way, the count rises without any change in doctoral output. This is the most likely explanation for a figure that is high relative to a country’s plausible output, and it is checkable: pull a sample of records and read what they actually are.
What this source is good for
- Order-of-magnitude sizing. If you need to know whether a population is in the thousands or the hundreds of thousands, this answers it in seconds and for nothing.
- Your own institution’s deposit rate. The comparison that matters most is internal: theses your graduate school recorded as awarded, against theses discoverable in the index. That ratio is a repository performance measure, and it is one you can act on.
- A reproducible method in a methods section. Because the query is a URL, a reader can re-run it. That is a materially stronger citation than a figure lifted from a vendor’s marketing page.
What it is not good for
Year-on-year trends, cross-country rankings, and any denominator in a percentage you intend to publish. For those you need the national statistical authority, and you need to know how current its figures are — the publication lag by source type is set out in how current your higher education data actually is.
It is also not a completion measure. An indexed thesis is a deposited output, not a rate, and the distinction between a repository count and a completion statistic is the same distinction we draw in where graduate completion and attrition data comes from.
How to write it up
Three sentences, in this shape:
A count of records typed as doctoral theses was retrieved from the OpenAIRE Graph search API on [date], filtered by country and by acceptance year. For Germany the API returned 14,804 records dated 2024, against 28,171 doctoral examinations passed reported by the Federal Statistical Office for the same year, a coverage ratio of approximately 53%. Figures from this source are counts of indexed records and are affected by aggregation lag, national repository coverage and inconsistent type labelling; they are reported here as indicative rather than as official statistics.
That paragraph is the difference between a number a reviewer accepts and one they query. The general principle — state the instrument, state its limits, then state the figure — is the same one that governs the far messier world of self-reported behaviour, which we work through in what student AI-use numbers actually measure.
If your graduate school wants its own deposit rate measured and its thesis pipeline instrumented rather than estimated, request an institutional evaluation and we will work through the method against your own records.
Frequently asked questions
How many doctoral theses are there in the open research record?
3,142,531 records typed as a doctoral thesis, retrieved from the OpenAIRE Graph search API on 18 August 2026. That is indexed records, not theses produced.
How many doctoral theses are produced worldwide each year?
No source counts this reliably. The index returned 154,889 records dated 2024 and 220,825 dated 2025, and the difference between those two is aggregation behaviour rather than output.
How many doctorates does Germany award annually?
28,171 doctoral examinations passed in 2024, 26,570 in 2023 and 27,692 in 2022, per the Federal Statistical Office, revised as at 5 February 2026.
What share of theses does the open index capture?
For Germany in 2024, about 53% — 14,804 indexed against 28,171 awarded. Treat that as one measured data point, not a general capture rate.
Does the API need an account?
Not for counting queries. Setting the size parameter to zero returns the total without records, which is what a count needs.
Can I compare countries with this?
Not for output. The between-country differences are dominated by repository infrastructure and metadata practice, so a cross-country table from this source measures deposit behaviour.
Why is the most recent year larger than the year before it?
Because records for a year continue arriving for a long time after it ends, and the direction of that flow is not uniform. Two adjacent years from an aggregator are not a trend.
Why might a small country show a large count?
Most likely because local repositories type master’s or licentiate work as doctoral. Pull a sample of records and read what they are before explaining the figure.
What is the best internal use of this?
Your own deposit rate: theses your graduate school awarded, against theses discoverable in the index. It is a repository performance measure you can act on.
Is this a substitute for national statistics?
No. For anything that will be published as a rate or a trend, use the national statistical authority and state its reference date.
What could you not verify?
Two British Library URLs for the UK doctoral thesis service returned HTTP 404 and the DART-Europe portal returned HTTP 403 on 18 August 2026, so we are not offering an explanation for the UK figure.
How should this be cited in a report?
Name the API, the query parameters, the retrieval date and the coverage caveat in the same sentence as the number. A URL a reader can re-run is a stronger citation than a figure from a report they cannot.