
Every criminology programme that supervises quantitative theses sees the same stall. A student has an approved topic on reoffending, a promising data source and a clear enthusiasm for the question, and then the proposal sits for a term because nobody can agree what “recidivism” means in this study, how long to follow people for, or how to handle those who have not reoffended by the time the data end. These are method questions, not topic questions, and they are predictable. A programme that builds method support into its structure turns a recurring bottleneck into a routine step. This piece explains where recidivism theses stall and sets out a support model a department can adopt in a single term.
Where does the stall start? With the definition
The National Institute of Justice defines recidivism as “a person’s relapse into criminal behavior, often after the person receives sanctions or undergoes intervention for a previous crime”. It identifies three primary measures: rearrest, reconviction and return to incarceration, with or without a new sentence. It states that recidivism is measured during a specific follow-up period after release, for example three years, and it cautions that acts of misconduct that do not result in official sanctions may also be considered but are harder to quantify. It frames recidivism alongside four connected concepts: incapacitation, specific deterrence, rehabilitation and desistance.
Each measure answers a different question. Rearrest records police contact, reconviction requires a court outcome, and return to incarceration depends on sentencing and parole practice. A student who writes “recidivism” without choosing one has not yet defined the dependent variable. The same discipline of conceptual and operational definition is described in the guide to definitions of terms in a thesis, and it applies here with extra force because each choice changes the headline figure.
What does a real recidivism report show about follow-up?
The 2018 update from the Bureau of Justice Statistics, 2018 Update on Prisoner Recidivism: A 9-Year Follow-up Period (2005–2014), is a useful teaching case because it states its choices clearly. It tracked 401,288 state prisoners released in 2005 across 30 states for nine years and measured recidivism by arrest. Its data came from state corrections reports to the National Corrections Reporting Program, together with national criminal history records from the FBI’s Interstate Identification Index and state repositories. It reports that 68% of the released prisoners were arrested within three years, 79% within six years and 83% within nine years. It reports that 44% were arrested in the first year and 24% in the ninth, that the 401,288 prisoners had 1,994,000 arrests over nine years, an average of five arrests per released prisoner, and that 82% of those arrested during the nine years were arrested within the first three, although 47% of those with no arrest by year three were arrested in years four to nine.
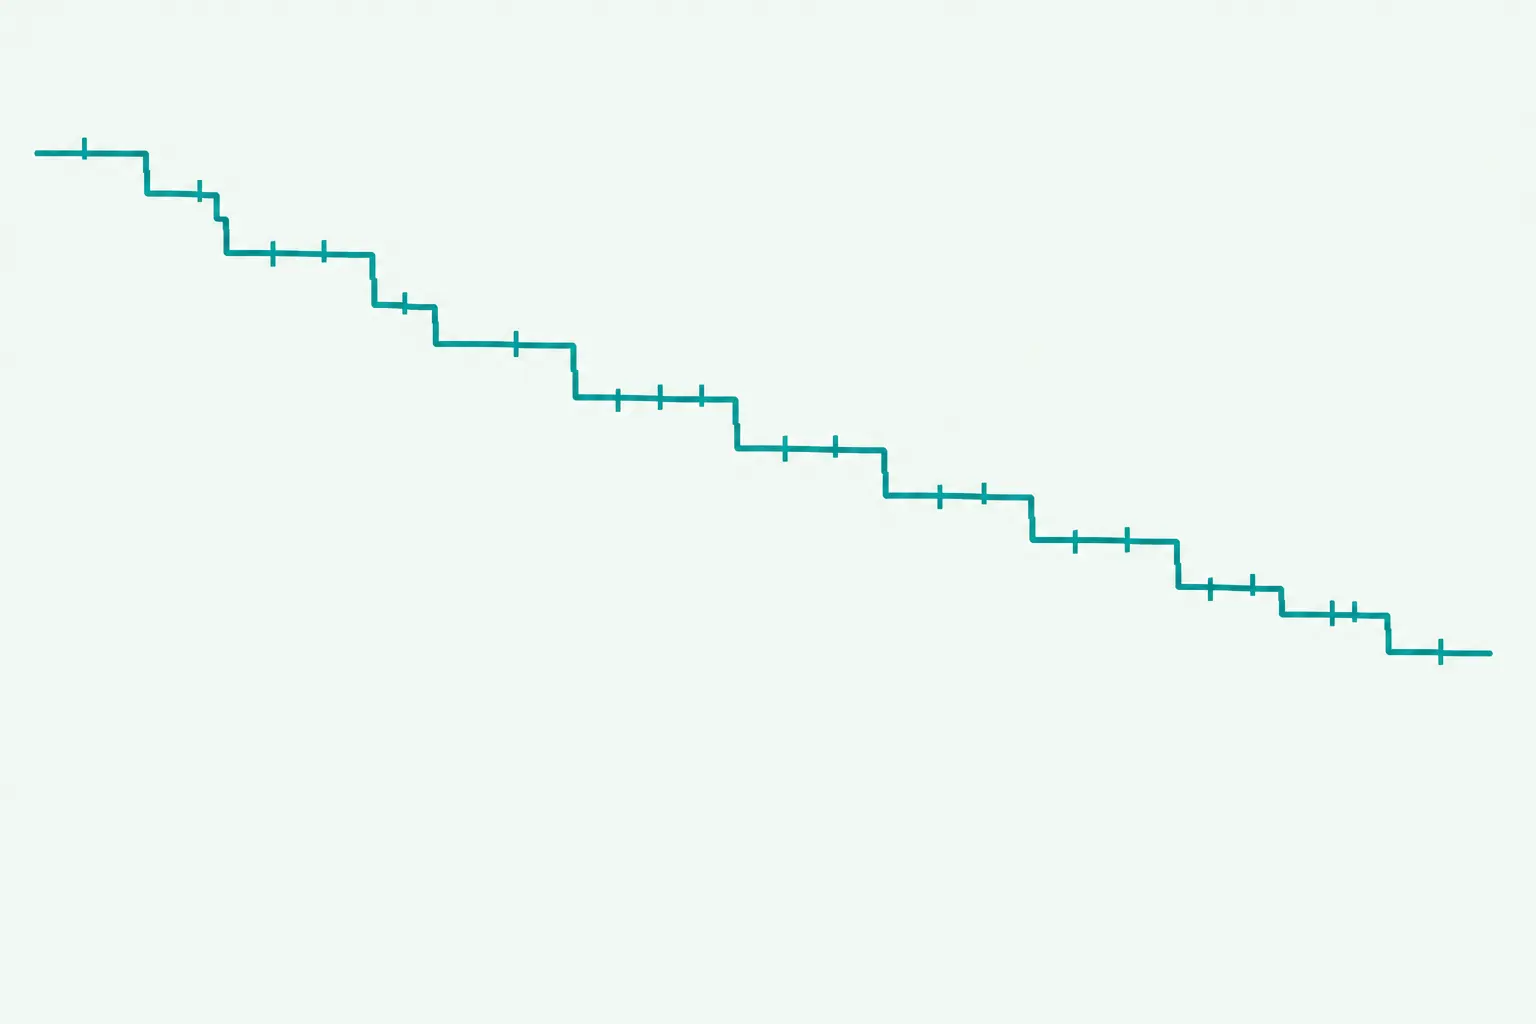
Three lessons follow for a thesis. The figure depends on the follow-up window, so a student must state it and justify it. The figure depends on the event, so rearrest rates cannot be compared with reconviction rates. And the risk is not constant over time: it is highest early and declines, which is exactly what a time-to-event method is designed to show.
Why do students reach for the wrong method?
Most students first summarise recidivism as a percentage: the share of a cohort rearrested within a fixed window. That is a legitimate descriptive statistic, but it breaks down when people are observed for different lengths of time. A person released two years before the data end cannot have been observed for five years. Treating that person as a non-reoffender at five years misstates the rate.
The standard answer is survival analysis, which is a family of methods for time-to-event data. Clark, Bradburn, Love and Altman, “Survival analysis part I: basic concepts and first analyses”, British Journal of Cancer (2003), describe the central idea: the main outcome is the time to an event of interest, called the survival time, and the event need not be death; the paper gives the time from remission to relapse as an example. It explains censoring: at the end of follow-up some individuals have not had the event, so their true time to event is unknown, and censoring also arises from loss to follow-up and from competing events. It describes the Kaplan-Meier method as estimating the survival probability nonparametrically from observed survival times, both censored and uncensored, and the log-rank test as comparing observed and expected event counts between groups. The paper comes from cancer research, but the logic transfers directly to the time until rearrest, reconviction or return to custody.
A fictional worked example a supervisor can check
The following is illustrative only. It uses invented numbers to show what the Kaplan-Meier calculation does with censored observations.
| Interval after release | At risk at start | Rearrested | Censored | Conditional survival | Cumulative survival |
|---|---|---|---|---|---|
| 0–12 months | 100 | 20 | 0 | 1 − 20/100 = 0.800 | 0.800 |
| 12–24 months | 80 | 10 | 8 | 1 − 10/80 = 0.875 | 0.800 × 0.875 = 0.700 |
| 24–36 months | 62 | 6 | 0 | 1 − 6/62 = 0.903 | 0.700 × 0.903 = 0.632 |
At the start of the second interval 80 people remain at risk; at the start of the third, 62 remain, because 10 were rearrested and 8 were censored. The estimated proportion not rearrested by 36 months is about 0.63, so the estimated cumulative rearrest proportion is about 0.37. A student who ignored censoring and divided total events (36) by the original 100 would report 36%, a close but biased figure; with heavier censoring the gap widens. The point for supervision is that the method uses everyone, including those observed for only part of the window.
What else makes these theses stall?
- Data access. The linked records that make recidivism analysis possible are often restricted. The guide to national justice and corrections data explains the public-use and restricted-use tiers that can add a term to a proposal.
- No agreed event window. Without a decision on follow-up length, the student cannot set a sample size or a data request.
- Covariate sprawl. Students include every available variable. A short list tied to the theory, defined in advance, avoids data dredging.
- Unclear comparison. A claim that a programme “reduces recidivism” needs a comparison group and a design that supports it, not only a rate for participants.
- Software hurdles. Students spend weeks on code for the first time. Shared templates save that time.
- Interpretation errors. Statistical significance is reported without a measure of effect size or a plain-language reading.

What does a method support model look like?
- A one-page recidivism decision sheet. The student states the event (rearrest, reconviction or return to custody), the start of follow-up, the window, how censoring will be handled and the comparison group. The supervisor signs before the proposal goes to committee.
- A shared analysis template. A documented script that reads a data file, produces a Kaplan-Meier curve and a log-rank comparison, with comments in plain language. Students adapt it; they do not write it from nothing.
- A methods clinic. A scheduled session each term, led by a statistician or methods-trained staff member, where students bring a proposal-stage decision sheet for review.
- A data-access guide. The department’s one-page summary of public-use and restricted-use routes, so that data decisions are made at topic approval.
- A reporting checklist. Event definition, window, censoring rule, number at risk, effect size and limitations, all stated in the results chapter.
- A review point. The methods lead reads the decision sheets from each cohort and records recurring problems, which feed the next clinic.
The model fits inside existing resources. It adds no new course and no new committee; it adds a document, a template and a scheduled session. The checklist for validating a thesis instrument offers a comparable structure for projects that rely on questionnaires.
How should supervisors talk to students about recidivism claims?
Careful language prevents the most visible errors. A student should say “rearrested within three years of release” and not “reoffended”, because arrest is not proof of an offence. They should report the window and the event with every figure, and they should avoid ranking jurisdictions whose definitions differ. If the thesis evaluates a programme, the student should describe the design honestly: a comparison of participants and non-participants who differ in many ways supports association, not proof that the programme caused the difference. Supervisors can ask three questions at every meeting: what is the event, who is observed for how long, and compared with whom?
The same questions protect the programme itself. Criminology theses often feed into local policy discussions, and a department that is known for careful definitions is more likely to be listened to.
What about ethics and the people in the data?
Recidivism studies use records about identifiable people, usually collected without their consent for another purpose. The proposal should therefore state who approved access, how the data will be stored, whether identifiers are removed before analysis and how small groups will be protected in tables. Supervisors should also ask students to consider how findings might be read. A curve that shows risk declining over time can be used to argue for support after release; a table of rates by group can be misread as a statement about individuals. Careful wording of limitations is part of the method, not an afterthought, and the methods clinic is a good place to review it.
Where does Tesify fit?
Method support, data access and the choice of design remain the department’s responsibility. Once a student has an approved plan and is writing, Tesify helps students structure and organise their thesis while they write 100% of the work themselves: more than 9,000 students have written over 15,000 chapters with Tesify. See how Tesify supports a thesis cohort.
Frequently asked questions
How does the National Institute of Justice define recidivism?
As a person’s relapse into criminal behavior, often after the person receives sanctions or undergoes intervention for a previous crime. It measures it through rearrest, reconviction and return to incarceration during a specific follow-up period.
Which measure should a thesis use?
The one that matches the research question and the available data. Rearrest, reconviction and return to custody measure different events, so a thesis must choose one, define it and avoid comparing it with the others.
What did the 2018 BJS update report?
For 401,288 state prisoners released in 2005 across 30 states and followed for nine years, 68% were arrested within three years, 79% within six and 83% within nine, with recidivism measured by arrest.
Why is a simple percentage not enough?
People are observed for different lengths of time. A simple percentage treats those with shorter follow-up as non-reoffenders, whereas time-to-event methods use the partial information they provide.
What is censoring?
According to Clark and colleagues, censoring occurs when some individuals have not had the event at the end of follow-up, so their true time to event is unknown. It also arises from loss to follow-up and competing events.
What is the Kaplan-Meier method?
A nonparametric method that estimates the probability of not yet having had the event from observed times, both censored and uncensored, as a cumulative product of conditional probabilities.
What does the log-rank test do?
It compares, at each event time, the observed number of events in each group with the number expected if there were no difference, using a chi-squared distribution to judge significance.
Can a thesis claim a programme reduces recidivism?
Only with a comparison group and a design that supports the claim. A rate for participants alone does not show that the programme caused it.
What should a department provide?
A decision sheet, a documented analysis template, a scheduled methods clinic, a data-access guide and a reporting checklist, reviewed each cohort.
Are the worked-example numbers real?
No. They are invented for illustration. Students must analyse their own data and report their own numbers at risk.